|
This picture however is not entirely consistent, since derivatives of {$G$} may display cusps, instead of discontinuities, and even divergences. Not like that expected in the first line for the second derivative (a delta function for a single point, unmeasurable, and continuous elsewhere), but divergences developing slowly as the transition is approached. These divergence reveal the existence and relevance of fluctuations, neglected in the thermodynamic mean field approach.
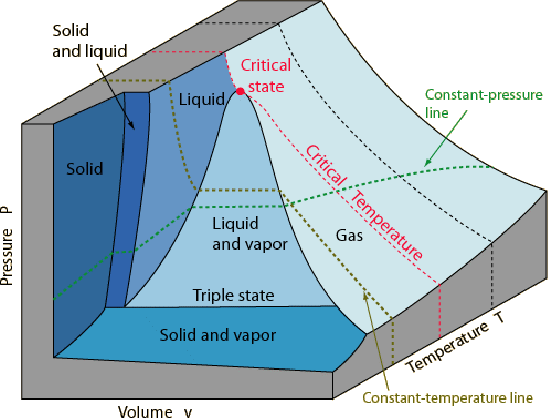
Fluctuations characterize particularly second order phase transitions. A clear example is the critical point of water, {$T_c,P_c$}, where phases cease to be stable. At higher pressure or temparature water is a supercritical fluid with properties different from any of the other phases. The density differences among liquid and vapour (proportional to their order parameter) vanishes. At the critical point fluctuations diverge (i.e. dynamic clusters of the two phases appear on any length- and time-scales). This gives rise to strong light scattering, called critical opalescence (the fluid scatters a lot at optical wavelengths and becomes whitish).
Note that critical fluctuations, hence the corresponding derivative of the Gibbs free energy, diverge only in the thermodynamic limit. Any finite sze sample has an intrinsic limit in its length scale, hence in its time scale.
Lev Landau proposed a simple mean field theory that accounts better for many properties of phase transitions, although still neglecting fluctuations. However, thei can be reconciled with the theory by small modifications. We shall review some of its features. The order of the phase transition in this scheme is simply dictated by the appearance of a discontinuity in the order parameter, in I order phase transitions, or by its absence, in II order, or continuous phase transition.
Top
Examples
Beside solid-liquid-gas phases of elements and mixtures, phase transitions are important in many contexts. The solid is generally more complex than a single phase because new degrees of freedom appear, as internal fields develop.
Ice, seen before, is a remarkable case of many structural phase transitions, where symmetry reduction plays a role. The leading electrostatic dipolar interaction, with its long range nature, is compatible with very reduced symmetry at zero temperature. As thermal energy increases, approximate symmetries appear. This is a process worth coming back to and it gives rise to a very rich variety of phases in ice.
First order transitions are accompanied by hysteresis. Very often structural transitions are first order, but examples of second order ones exist (e.g. in Sr2CuWO6 at 870 K).
The ferromagnetic transition is second order in zero applied field and the order parameter, magnetization {$M$} goes continuously to zero at the Curie temperature {$T_C$}. Static uniform susceptibility {$\partial M /\partial T$} diverges for {$T\rightarrow T_C$}.
Also the Néel transition between the paramagnetic and the antiferromagnetic state is a second order transition. The order parameter is the staggered, or sublattice magnetization, {$M_s$} with diverging susceptibility at the wavevector characteristic of the order, typically at the Brilllouin zone boundary: if the primitive cell is doubled {$a^\prime = 2a$} by the alternating antiferromagnetic moments, the propagation vector is {$q_{AF}=2\pi/a^\prime = \pi/a$} and {$\chi(q_{AF})=\chi(\pi/a)$} diverges.
In both cases fluctuations become critical, i.e. the fluctuations corresponding to the order, {$q_c=0$} for the ferromagnet and {$q_c=q_{AF}$} for the Néel antiferromagnet, slow down and grow in correlation length in the paramagnet, as {$T\rightarrow T_c^+$}. This is analogous to critical opalescence. It corresponds the appearance of clusters of the new order on any length- and time scale at {$T_c$}, i.e. to the divergence of the response function {$\chi(q=q_c,\omega=0)$}. A similar thing happens for {$T\rightarrow T_c^-$} to the spin wave modes, with the appearance of dynamical disordered clusters in the ordered phase.
Liquid crystals made of lower symmetry elongated molecules (compared to globular molecules) undergo transitions from liquid to nematic phases, where translations are still disordered, like in a liquid, but orientations are nearly static, like in a solid: molecules align within a domain along a given direction (the nematic director). Depending on the details of the molecular symmetry ,ore complex phases appear. The nematic-liquid transition is first order.
Biomolecules undergo phase transitions of similar nature, since they are often long polymer chains. Lipids can thus form membranes and mycelles, very important for their functionality. Also folding of proteins and DNA, essential for their biological functions, is governed by phase transition: thus life cannot work outside pretty narrow thermodynamic conditions.
|